
Meeting Analytics
BRIEF
What Happens After the Meeting? The Answer is in the Data
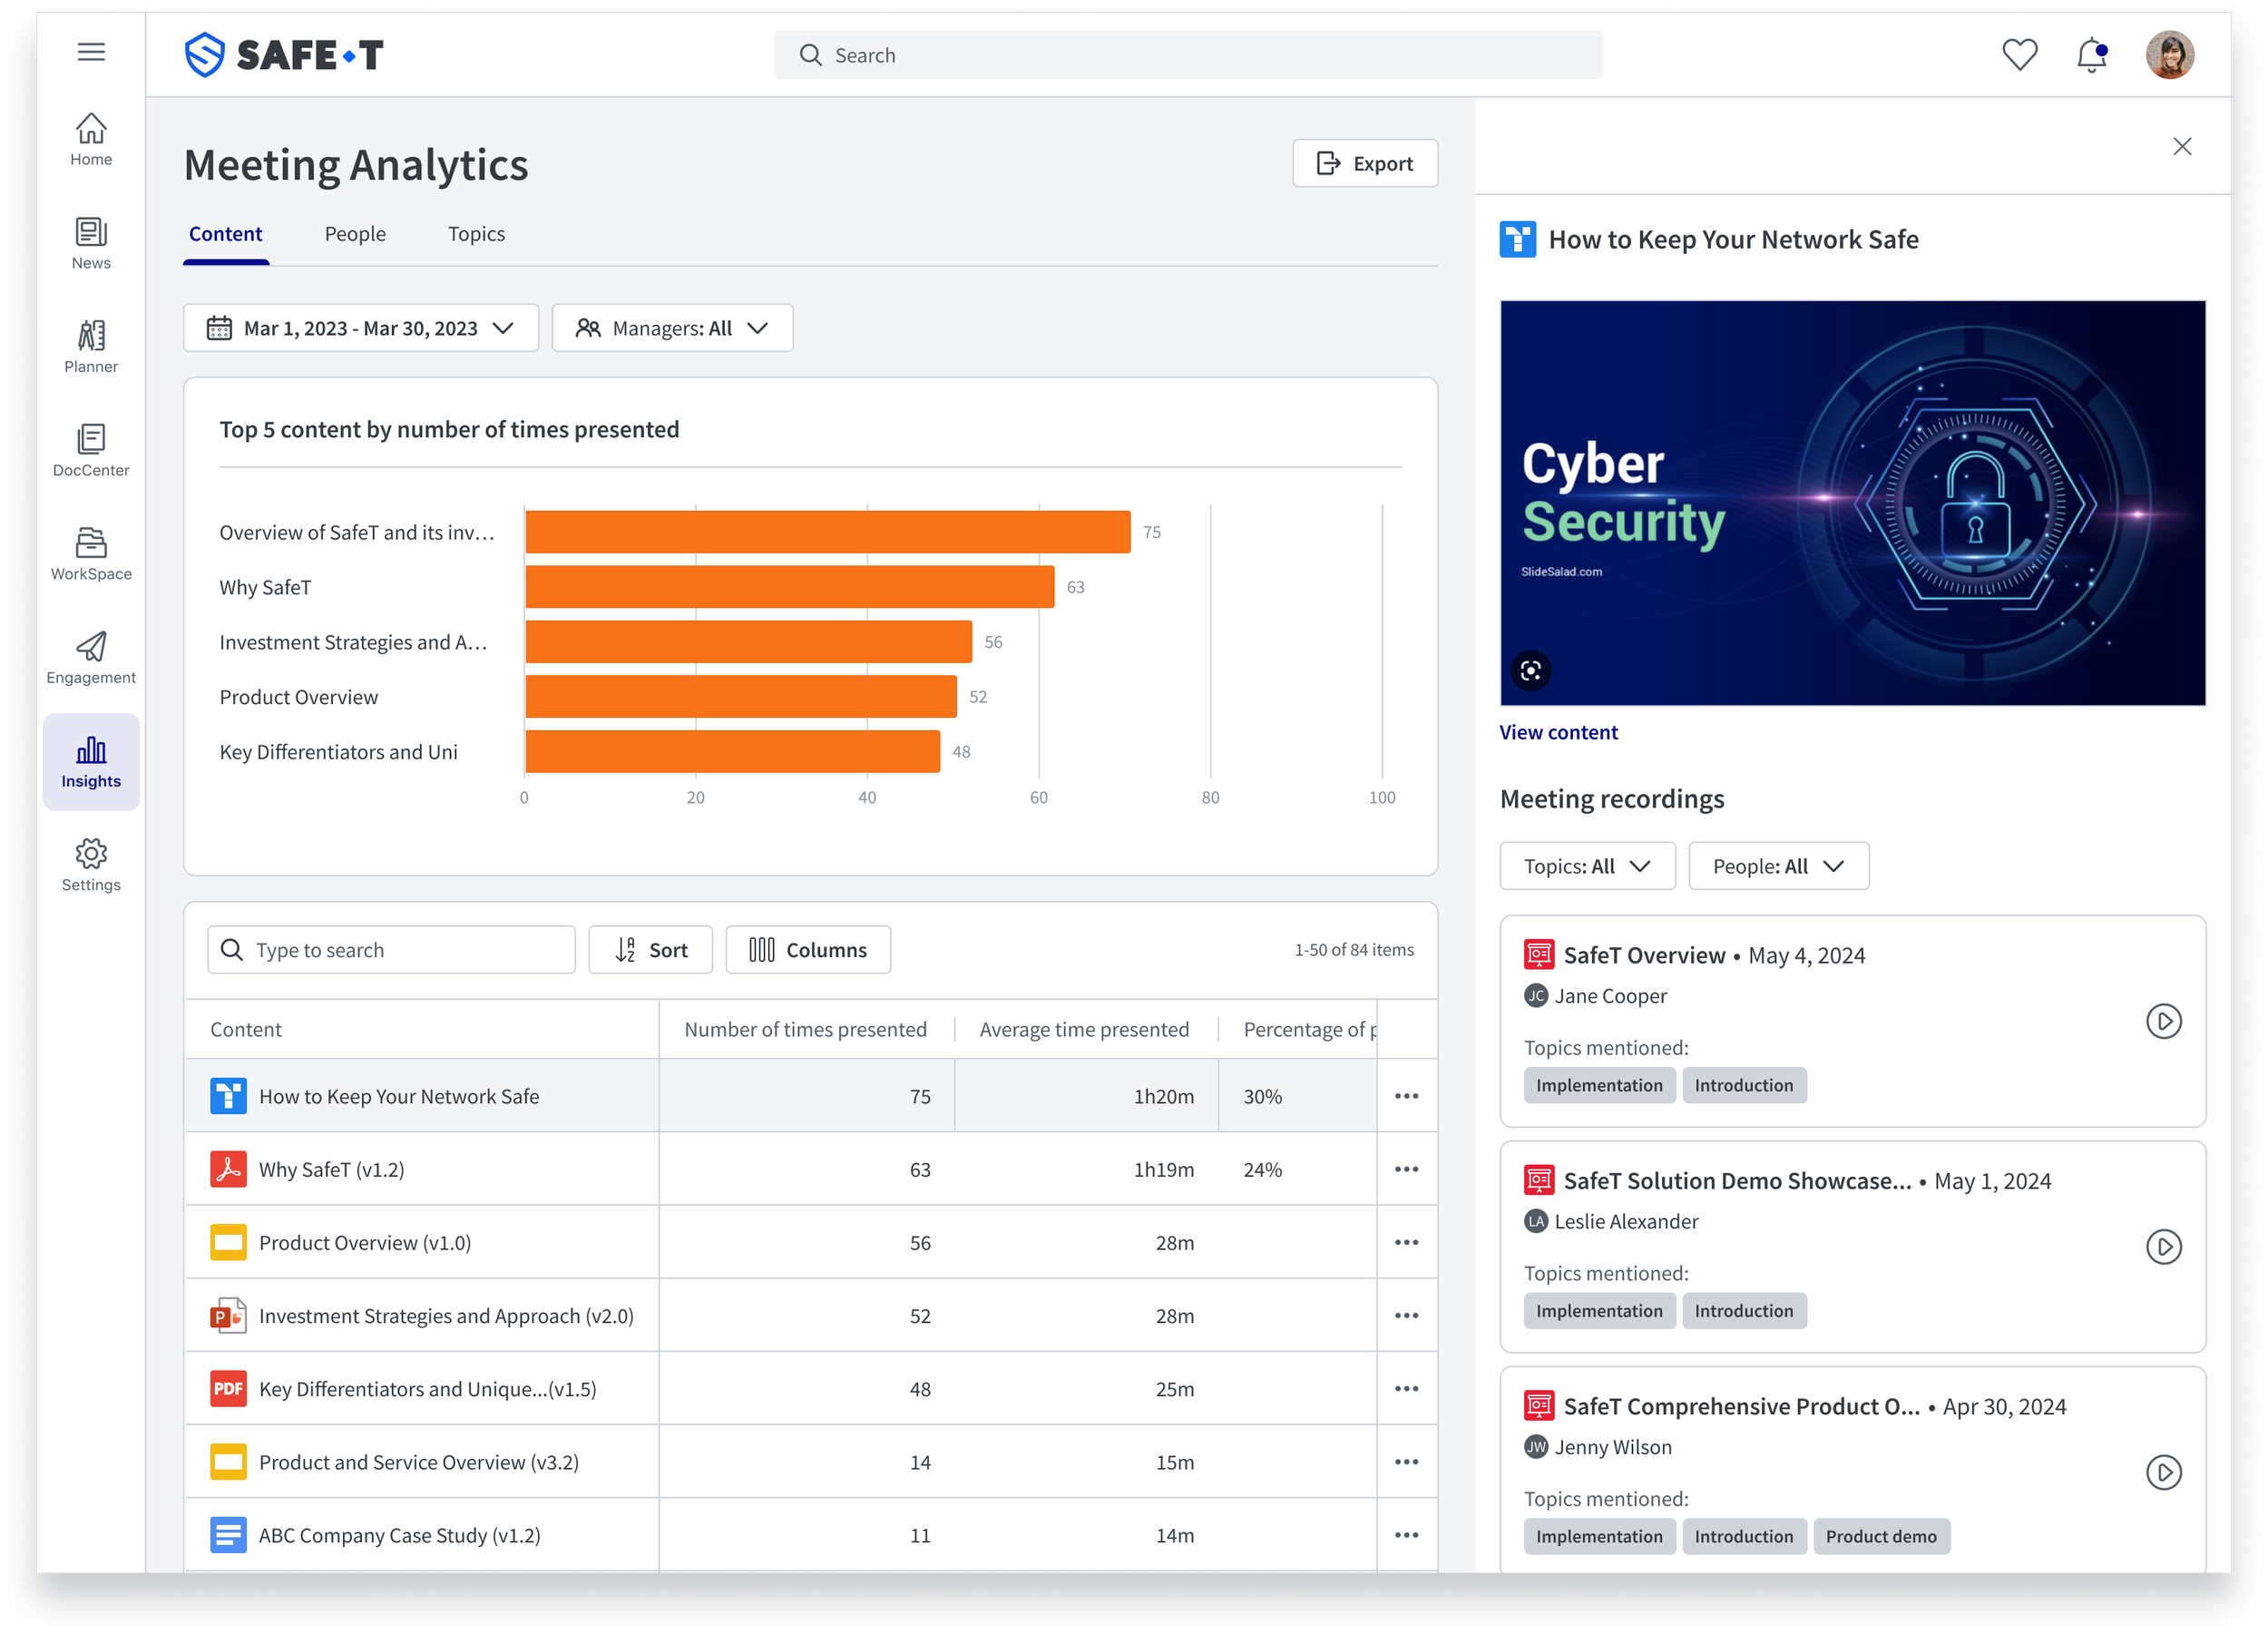
The relentless pursuit of closing deals keeps sellers in a constant meeting marathon. Sales managers crave insights into team performance, while enablers yearn to understand content usage and effectiveness. Seismic solves this by going beyond attendance, offering a wealth of insights to improve content and engagement. By tracking content shared (slides, demos) and participant behavior (topic frequency, keywords used, questions asked), analytics empower enablers and marketers to understand material effectiveness and seller adherence to talk tracks. This data guides training improvements and identifies areas for seller growth. Additionally, AI-powered insights reveal end-to-end impact, facilitating behavioral change and program optimization for a maximized return on meetings.
My role
As Product Design Manager, I spearheaded an initiative to empower Sales Managers and Enablers to understand team performance and content effectiveness during meetings. Deep user research into their needs ensured the data visualization presented actionable insights in a clear and user-friendly format. Ultimately, the goal was to equip them with the tools to help their teams thrive.
Team
👩🏻🎨 1 Senior designers
👩🏻💼 1 Product managers
BUSINESS IMPACT
Optimize sales processes by identifying performance gaps through meeting data.
Maximize content effectiveness with insights on winning content and areas for improvement.
Identify training opportunities and suggest content based on meeting outcomes.

THE DISCOVERY
Main task
HMW design a data-rich dashboard for Seismic Meetings, empowering Sales Managers and Enablers to analyze team performance and content engagement, driving data-backed optimization.

Deep dive
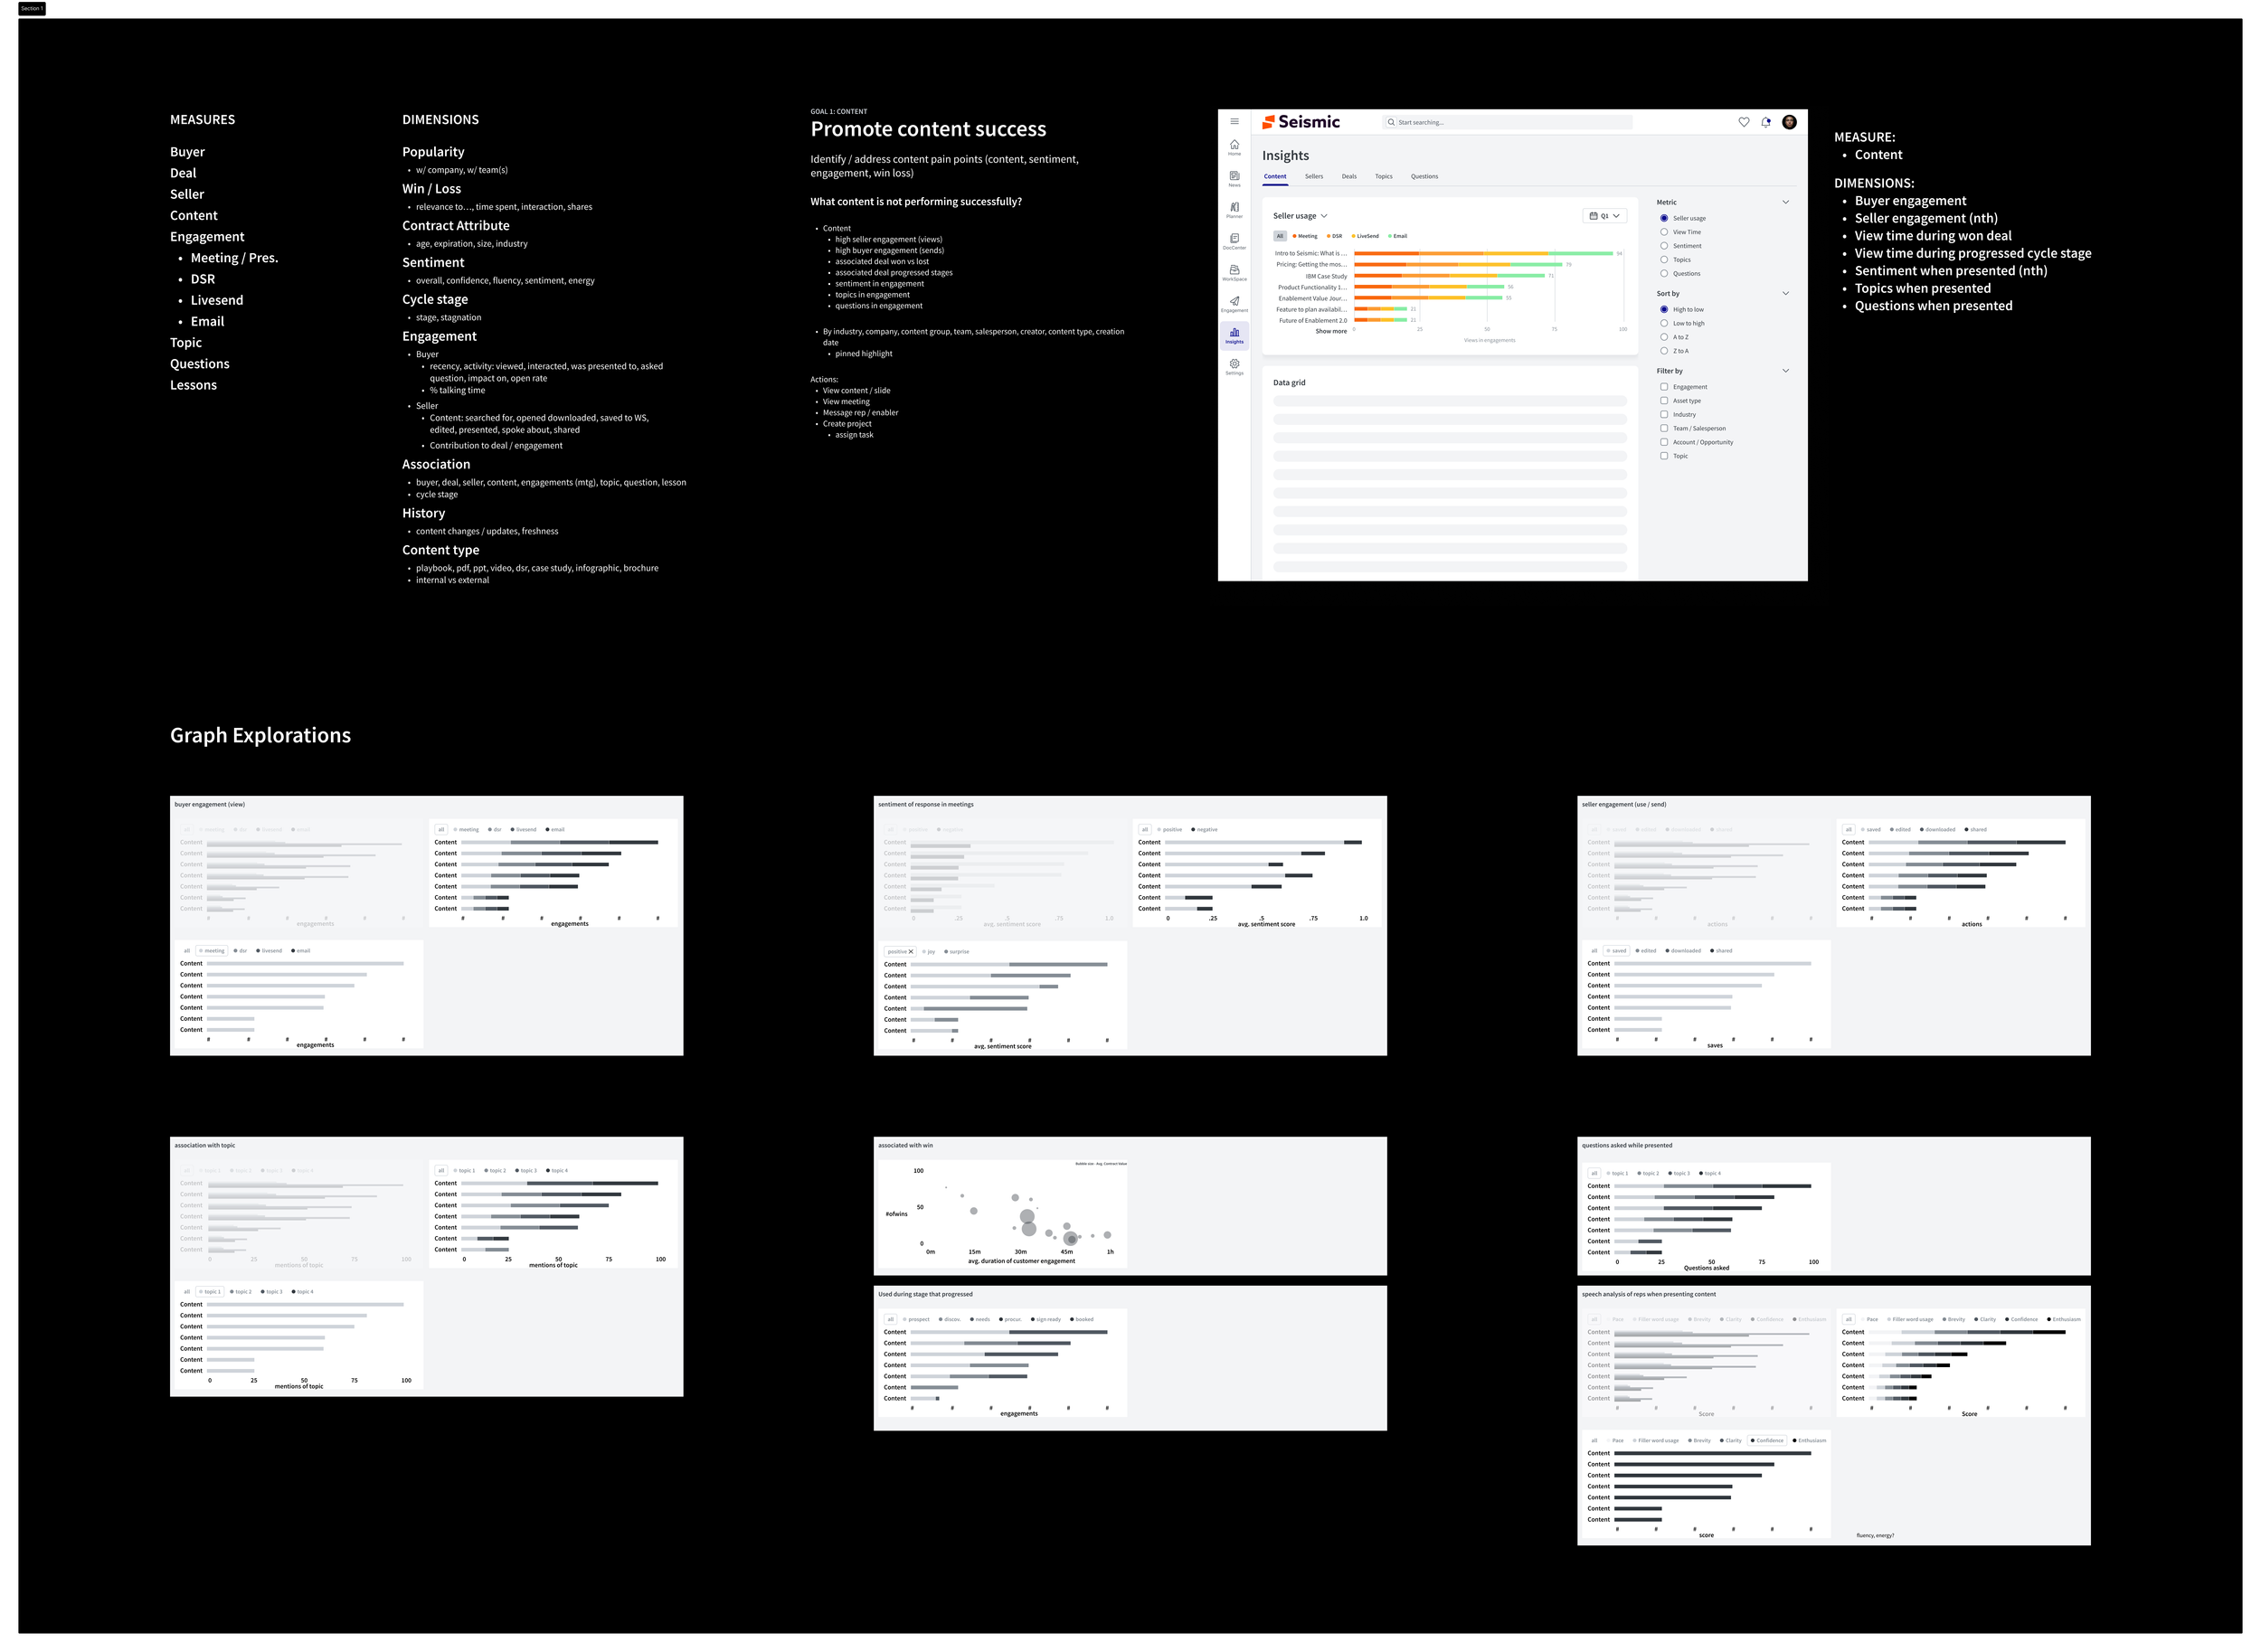
Collaborating with Seismic's top Enablers and Sales Managers, we conducted in-depth user research to understand their specific needs for analyzing team performance and content engagement. This valuable access allowed us to tailor the analytics dashboard for maximum impact.
Ideation
Leveraging our user research, we synthesized key findings to define the core goals of the dashboard. This involved identifying metrics, outlining measurement methods, and designing a user-friendly presentation that facilitates data comprehension.
THE RESULTS
Content Analytics
Meeting Detail Modal
People Analytics
Topic Analytics